How to Graph and Solve a Linear Function Step by Step
Understanding how to graph linear functions is a key Algebra 1 skill. In this guide, we’ll explain what linear functions are, how to graph them, and how slope and intercepts work—complete with examples and free worksheets.
What Is a Linear Function?
A linear function is a function whose graph is a straight line. Its general form is:
𝑦 = 𝑚𝑥 + 𝑏
where:
- 𝑚 is the slope (rate of change)
- 𝑏 is the y-intercept (where the line crosses the y-axis)
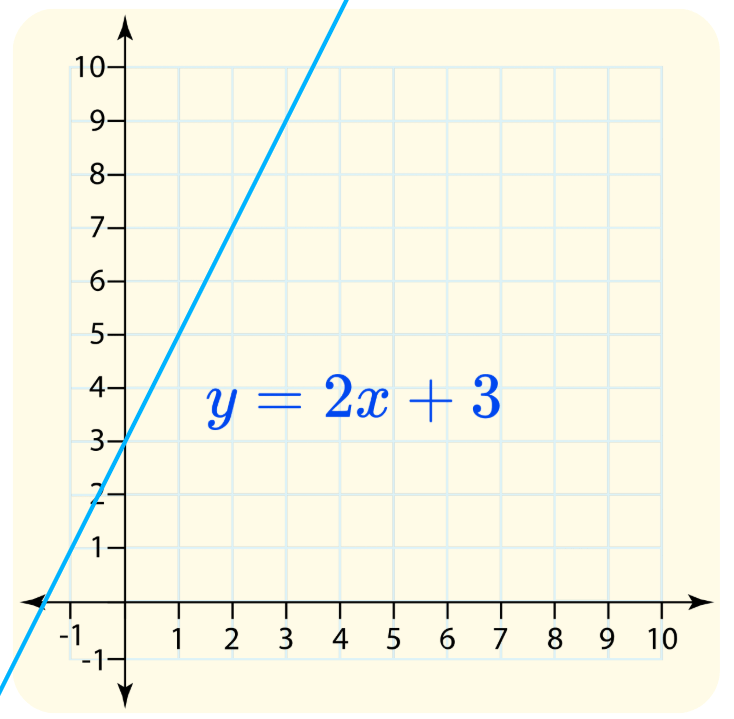
Example:
Here is the graph of the linear function 𝑦 = 2𝑥 + 3:
Key Features of a Linear Function Graph
1. Slope
The slope tells us how steep the line is.
The value of the slope is found by dividing the change in 𝑦 by the change in 𝑥, which is often written as:
\[ \text{Slope} = \frac{\text{change in } y}{\text{change in } x} = \frac{\Delta y}{\Delta x} \]
In 𝑦 = 2𝑥 + 3, the slope 𝑚 = 2.
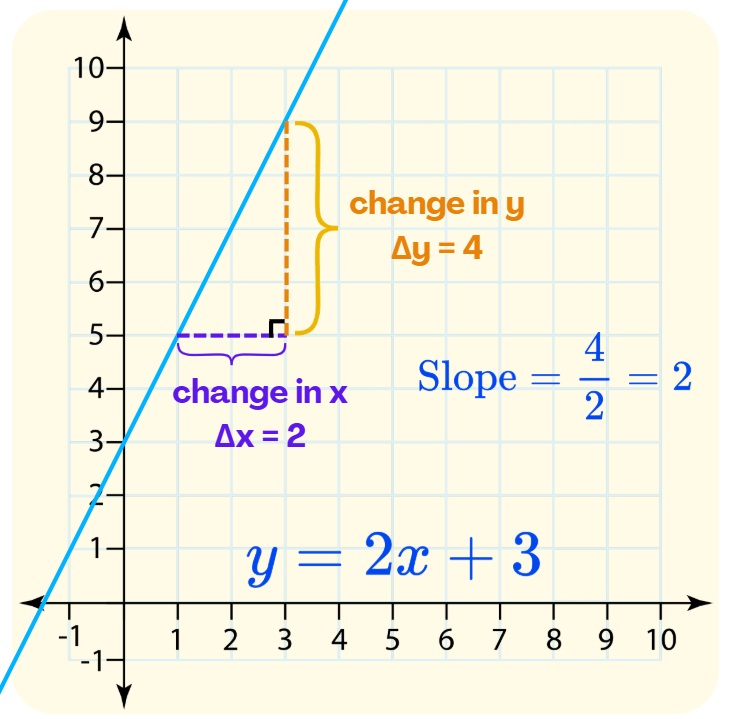
This means: every time 𝑥 increases by 1, 𝑦 increases by 2.
Special Cases:
- If a line is horizontal, the slope is 0 (e.g., 𝑦 = 5).
- If a line is vertical, the slope is undefined (e.g., 𝑥 = 4).

2. Increasing or Decreasing
The sign of the slope shows whether the line is increasing or decreasing.
A linear function is:
- Increasing if 𝑚 > 0 (line goes up);
- Constant if 𝑚 = 0 (line is flat);
- Decreasing if 𝑚 < 0 (line goes down).

Our example 𝑦 = 2𝑥 + 3 is increasing because the slope is positive. On the other hand, a function like 𝑦 = -2𝑥 + 3 has a negative slope, which means it is decreasing.

3. X-Intercept
The x-intercept is where the line crosses the x-axis (when 𝑦 = 0). The x-intercept is also called the zero or root of the linear equation. It represents the value of 𝑥 that makes the linear function equal to zero.
Example: in 𝑦 = 2𝑥+3, set 𝑦 = 0:
\[ 0 = 2x + 3 \quad \Rightarrow \quad x = -\frac{3}{2} \]

The x-intercept is at \( \left(-\frac{3}{2}, 0\right) \).
4. y-Intercept
The y-intercept is where the line crosses the y-axis (when 𝑥 = 0), which is the same value of the constant, 𝑏, in the linear function: 𝑦 = 𝑚𝑥 + 𝑏.
Example: in 𝑦 = 2𝑥 + 3, set 𝑥 = 0:
𝑦 = 2 × 0 + 3 = 3
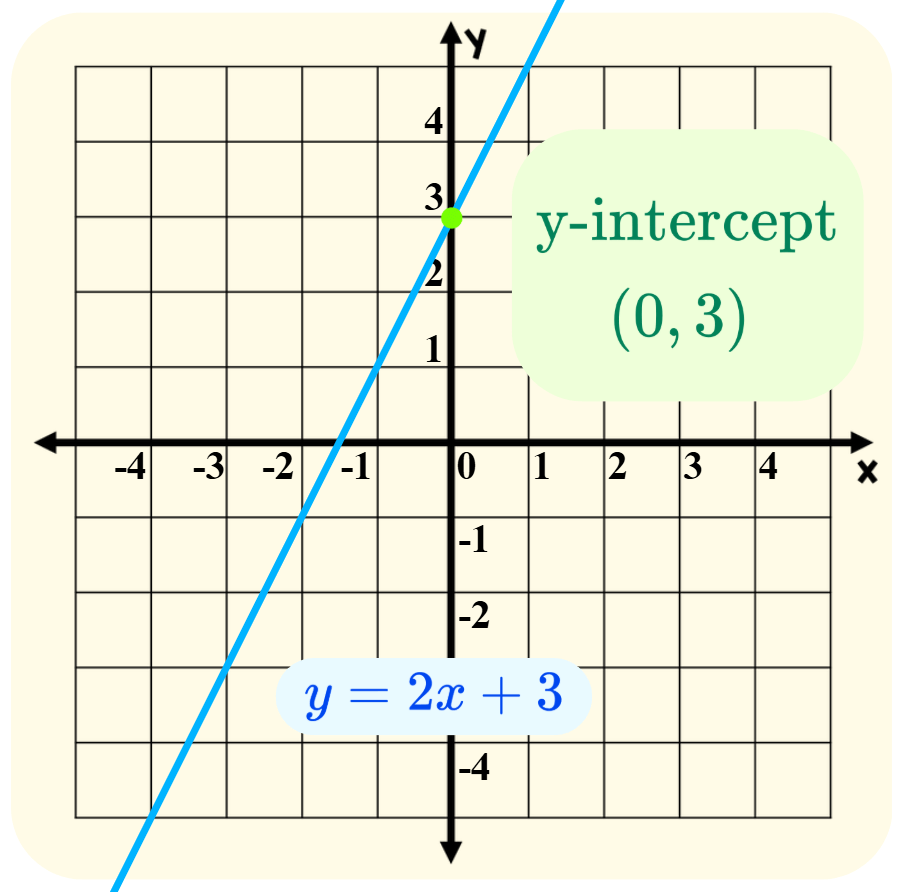
The y-intercept is at (0, 3).
Example Problems (with Solutions): The Graph of Linear Functions
Example 1
Problem:
The graph of a line passes through the points (2, 7) and (8, 4). What is the slope of the line?
Solution:

\[ \text{Slope} = \frac{\Delta y}{\Delta x} = \frac{4 – 7}{8 – 2} = \frac{-3}{6} = -\frac{1}{2} \]
The slope of the line is
\[ m = -\frac{1}{2} \]
Example 2
Problem:
What are the x-intercept and the y-intercept of the linear function 𝑦 = 4𝑥 – 5?
Solution:
Set 𝑥 = 0, and solve for 𝑦:
𝑦 = 4 × 0 – 5 = -5
So, the y-intercept is (0, -5).
Set 𝑦 = 0, and solve for 𝑥:
0 = 4𝑥 – 5
4𝑥 = 5
𝑥 = \(\frac{5}{4}\)
So, the x-intercept is \( \left(\frac{5}{4}, 0\right) \).
Therefore, the x-intercept is \( \left(\frac{5}{4}, 0\right) \), and the y-intercept is (0, -5).
Summary: Keys to the Graph of a Linear Function
- A linear function is a function whose graph is a straight line. One of its most common forms is 𝑦 = 𝑚𝑥 + 𝑏.
- Slope (m) tells us how steep the line is.
- A positive slope means the line is increasing (goes up).
- A negative slope means the line is decreasing (goes down).
- Slope is calculated as:
\[ \text{Slope} = \frac{\text{change in } y}{\text{change in } x} = \frac{\Delta y}{\Delta x} \]
- The y-intercept (𝑏) is the point where the line crosses the y-axis. To find it, set 𝑥 = 0.
- The x-intercept is where the line crosses the x-axis. To find it, set 𝑦 = 0 and solve for 𝑥.
Additional Math Topics for Algebra 1 – with Free Worksheets
- How to Represent Linear Functions: Slope-Intercept vs Point-Slope Form
- Different Forms of Linear Functions: Standard, Slope-Intercept & Point-Slope
- Linear Functions: The Features of Parallel and Perpendicular
Want more printable practice?
To access more printable worksheets on other math topics, visit this page.
About Think Academy
Think Academy, a leading K–12 math education provider wholly owned by TAL Education Group, is dedicated to helping students build strong mathematical foundations and critical thinking. Our structured curriculum provides multiple course levels designed to accommodate students with diverse academic goals and proficiency levels, ensuring targeted and effective learning experiences. Supported by advanced teaching methods, expert instructors, and innovative AI technology, Think Academy consistently demonstrates excellence, trustworthiness, and proven expertise in mathematics education.
Want more insights on math education and parenting tips? Subscribe to our newsletter for weekly expert advice and updates on the latest learning tools.

Leave a Comment & Share Your Thoughts!

Share This Story, Choose Your Platform!
Related Posts


real helpful👍