Identifying Linear vs. Nonlinear Functions
By Grade 7 at Think Academy (Grade 8 in school), students begin distinguishing between linear and nonlinear functions. The challenge isn’t just recognizing equations—it’s avoiding common pitfalls: mixing up straight versus curved graphs, overlooking the constant rate of change in tables, or forgetting that functions can appear in multiple forms. This guide walks through equations, graphs, and tables so students can confidently identify whether a function is linear or nonlinear.
Identify Linear vs. Nonlinear Functions by Looking at the Equation
Equations of Linear Function
Linear equations can be written in different forms, such as slope-intercept form, point-slope form, and the general form, but all of them describe the same straight line on a graph.
A linear function’s general form is:
𝑦 = 𝑚𝑥 + 𝑏
where:
- 𝑚 is the slope (rate of change)
- 𝑏 is the 𝑦-intercept (where the line crosses the 𝑦-axis)
Example:
𝑦 = 2𝑥 + 3
Equations of Nonlinear Function
Nonlinear functions often have equations where:
- The variable has an exponent other than 𝟏 (like 𝑥², 𝑥³, etc.);
- The variable is in the denominator;
- The variable appears inside a root.
Example:
𝑦 = 𝑥² + 2
Identify Linear vs. Nonlinear Functions by Looking at the Graph
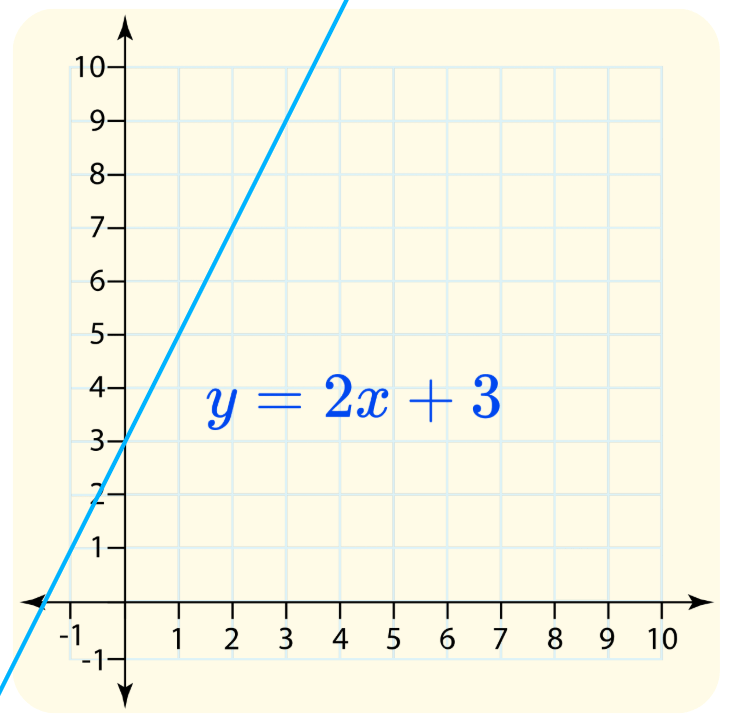
Graphs of Linear Function
A linear function is a function whose graph is a straight line.
Example:
Graphs of Nonlinear Function
A nonlinear function is any function that does not create a straight line when graphed. Instead, its graph could be curved, wavy, or take on other shapes.
Example:

Identify Linear vs. Nonlinear Functions by Looking at a Table
Tables of Linear Function
A linear function in a table has a constant rate of change (slope), meaning the ratio of the change inyto the change inxis the same for all pairs of points.
Example:

Tables of Nonlinear Function
On the contrary, a table represents a nonlinear function if the rate of change (or slope) between consecutive points is not constant.
Example:

Tables, mappings, and ordered pairs all numerically display a function. The method for determining whether a function is linear or nonlinear is similar for all of them.
Example Problems: Identifying Linear vs. Nonlinear Functions
- Is 3𝑥 + 𝑦 − 4 = 0 linear or nonlinear?
Answer:
3𝑥 + 𝑦 − 4 = 0 ⟹ 𝑦 = −3𝑥 + 4

This is a linear function with a slope of −3 and a 𝑦-intercept of 4.
- Given the table:

Is the equation represented by this table linear or nonlinear?
Answer:
Look at how the outputs change based on the change of input:
- When the input changes from 0 to 1, the input changes by 1 and the output changes by 1.
- When the input changes from 1 to 2, the input changes by 1 and the output changes by 3.
- When the input changes from 2 to 3, the input changes by 1 and the output changes by 5.
The changes are not constant, so this function is nonlinear.
Summary: Identifying Linear vs. Nonlinear Functions
- A linear function makes a straight line and follows the equation 𝑦 = 𝑚𝑥 + 𝑏.
- A nonlinear function makes a curve or other shape, and its equation includes exponents, roots, or variables in the denominator.
- We can identify functions by checking the equation, the graph, the table of values, and other relevant information.
Want more printable practice?
Additional Math Topics for Grade 8 – with Free Worksheets
- How to Solve Equations with Variables on Both Sides in 3 Simple Steps
- How to Solve Equations with Parentheses in 4 Simple Steps
- How to Solve Equations with Fractions and Decimals in 3 Simple Steps
About Think Academy
Think Academy, a leading K–12 math education provider wholly owned by TAL Education Group, is dedicated to helping students build strong mathematical foundations and critical thinking. Our structured curriculum provides multiple course levels designed to accommodate students with diverse academic goals and proficiency levels, ensuring targeted and effective learning experiences. Supported by advanced teaching methods, expert instructors, and innovative AI technology, Think Academy consistently demonstrates excellence, trustworthiness, and proven expertise in mathematics education.
Want more insights on math education and parenting tips? Subscribe to our newsletter for weekly expert advice and updates on the latest learning tools.

Leave a Comment & Share Your Thoughts!

Share This Story, Choose Your Platform!
Related Posts


